Multi-Period Study: Tech Stocks vs. Gold, Bitcoin & S&P 500 for NASDAQ:META by TrendAdvantage
🎯 Objective This study evaluates how **consensus technology stock recommendations** from leading financial publications performed across four different investment horizons compared with three widely followed benchmarks: - 📈 S&P 500 - 🥇 Gold - ₿ Bitcoin Four historical recommendation baskets (approximately **10-year, 5-year, 3-year, and 1-year**) were constructed and evaluated using two investor-focused performance metrics: - Total Return** (including dividends where applicable) - Maximum …
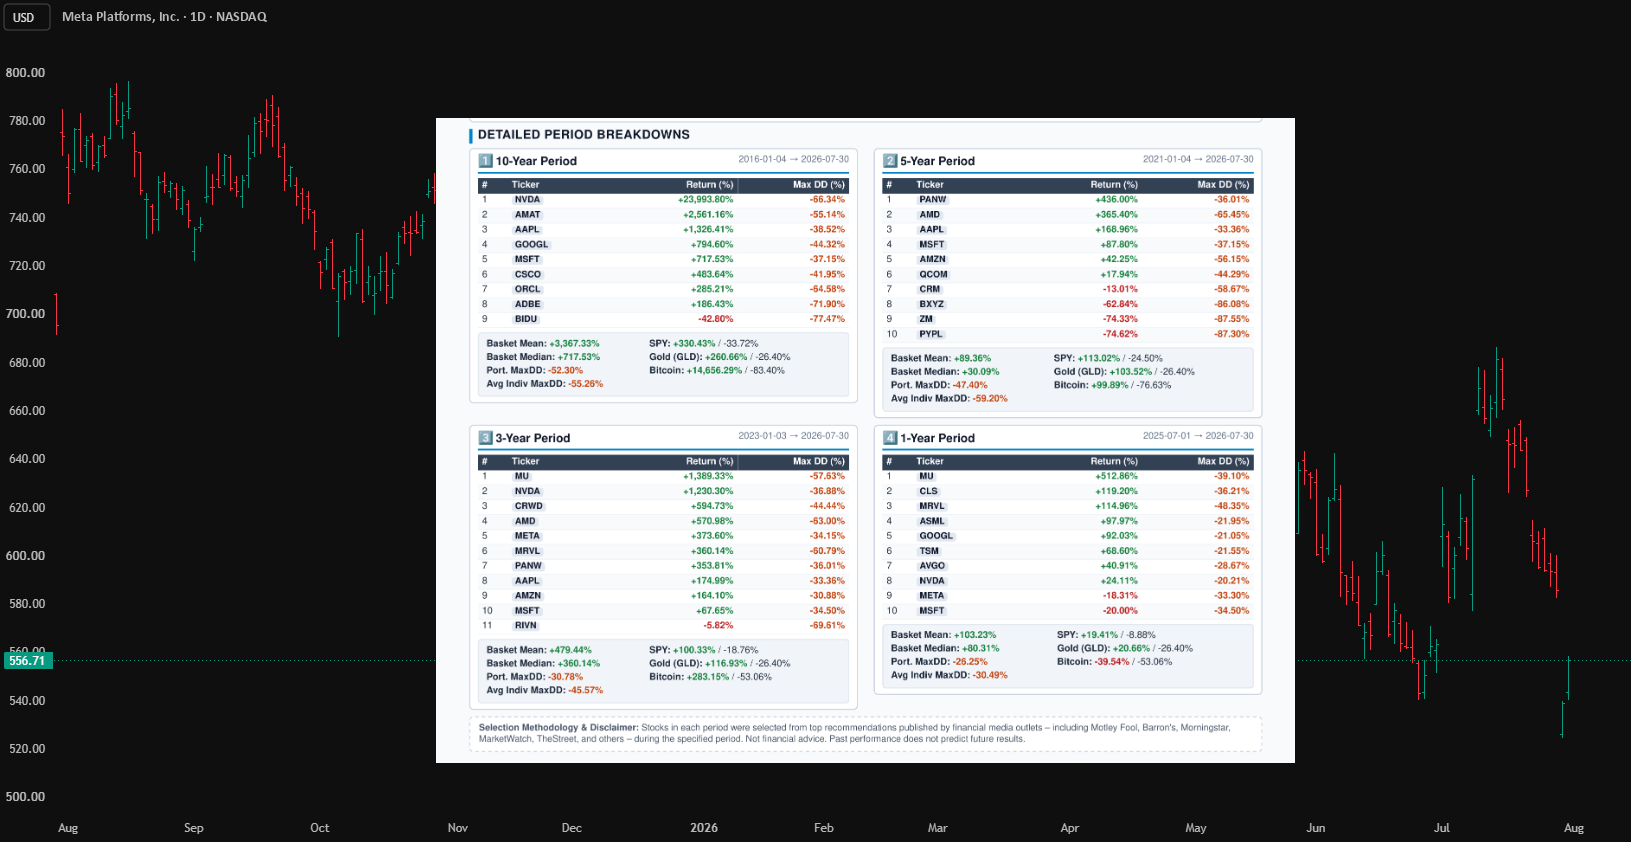
🎯 ObjectiveThis study evaluates how **consensus technology stock recommendations** from leading financial publications performed across four different investment horizons compared with three widely followed benchmarks:- 📈 S&P 500- 🥇 Gold- ₿ BitcoinFour historical recommendation baskets (approximately **10-year, 5-year, 3-year, and 1-year**) were constructed and evaluated using two investor-focused performance metrics:- Total Return** (including dividends where applicable)- Maximum Drawdown** (largest peak-to-trough decline)The objective was to evaluate not only which investments generated the highest returns, but also the level of risk investors experienced while achieving those returns. ---🛠️ Methodology1. Basket ConstructionFor each investment period, technology stocks were selected from recommendations published by leading financial publications and research platforms *(e. g. , Motley Fool, Barron's, Morningstar, MarketWatch, TipRanks, and Seeking Alpha)* near the beginning of each period. Stocks were ranked by recommendation frequency across multiple sources to produce a consensus basket. Selections were independently cross-checked to ensure consistency. 2. Performance MeasurementEach basket was evaluated from its respective start date through a common end date using:* Total Return** based on adjusted closing prices *(including dividends and splits)*. * Maximum Drawdown**, measuring the largest decline from a previous peak. * An **equal-weight buy-and-hold portfolio** was created for each basket to measure overall portfolio-level performance and drawdown. 3. Benchmarks & Data* Benchmarks:** S&P 500, Gold, and Bitcoin over the exact same investment windows. * Data Source:** Historical market data obtained from Yahoo Finance and processed via Python in Google Colab using a consistent, reproducible framework. ---📈 Results✅ Return: Basket vs. Benchmarks- 🚀 **2016 Basket:** Mean return **+3,367%**, comfortably outperforming the **S&P 500 (+330%)** and **Gold (+261%)**, although Bitcoin produced an extraordinary **+14,656%**. NVIDIA (+23,994%) accounted for much of the basket's exceptional performance. - ⚠️ **2021 Basket:** Mean return **+89%**, underperforming both the **S&P 500 (+113%)** and **Gold (+104%)**. This was the only period where consensus technology selections failed to beat a passive index, largely due to severe declines in PayPal, Zoom and Block. - 🏆 **2023 Basket:** Mean return **+479%**, decisively outperforming the **S&P 500 (+100%)**, **Gold (+117%)**, and **Bitcoin (+283%)**, making it the strongest overall basket in the study. - 📈 **2025 Basket:** Mean return **+103%**, substantially outperforming both the **S&P 500 (+19%)** and **Gold (+21%)**, while Bitcoin declined **−40%** over the same period. ---⚠️ Risk: Maximum Drawdown & Diversification- ✅ The **largest diversification benefit** occurred in the **2021** and **2023** baskets, where the portfolio's maximum drawdown was **11. 8** and **14. 8 percentage points** smaller than the average drawdown of the individual stocks. - ⚠️ Every technology basket experienced a **larger maximum drawdown** than the S&P 500 over the same investment period, demonstrating that higher returns required accepting greater volatility. - 🥇 Gold produced the **same maximum drawdown (-26. 4%)** across all four investment windows because its largest decline occurred entirely within **Jan–Jul 2026**. - ₿ Bitcoin's maximum drawdown depended heavily on the observation window:- **−83. 4%** (2017–18 crash) appears only in the 10-year study. - **−76. 6%** (2021–22 crash) appears in windows of approximately five years or longer. - Shorter windows capture only the more recent **−53. 1%** correction (Oct 2025–Jun 2026). ---## ⭐ Durable FavoritesSeveral companies appeared repeatedly across multiple recommendation periods:- 🍎 Apple — 2016, 2021, 2023- 🪟 Microsoft — All four baskets- 🚀 NVIDIA — 2016, 2023, 2025- 💾 Marvell Technology — Two baskets- 🔒 Palo Alto Networks — Two baskets---🏆 Biggest Winners- 🚀 **NVIDIA (2016):** **+23,994%**, the highest return in the entire study despite experiencing a **−66. 3%** maximum drawdown. - 💾 **Micron Technology:** Ranked #1 in both the **2023 (+1,389%)** and **2025 (+513%)** baskets. - 🛡️ **CrowdStrike:** Returned **+595%** over three years despite a major outage-related setback and a **−44. 4%** maximum drawdown. ---❌ Biggest Disappointments- 📉 **PayPal, Zoom and Block (2021):**- Returns between **−63%** and **−75%**- Maximum drawdowns between **−86%** and **−88%**- Worst combination of return and risk in the entire study. - 📉 **Baidu (2016):**- Return: **−43%**- Maximum Drawdown: **−77%**- 📉 **Rivian (2023):**- Return: **−6%**- Maximum Drawdown: **−70%**---📌 ConclusionAcross four investment horizons, consensus technology stock recommendations generally outperformed traditional benchmarks, beating both the **S&P 500** and **Gold** in **three of the four** study periods. The principal exception was the **2021 basket**, which was assembled near the peak of the post-pandemic growth-stock cycle. As interest rates increased and market leadership shifted, many high-growth technology companies experienced substantial valuation contractions, causing the basket to underperform the S&P 500. In contrast, the **2023 basket** benefited from the powerful technology-led bull market driven by artificial intelligence and semiconductor demand, producing the strongest broad-based outperformance of the study. The results also demonstrate the importance of **diversification**. Although individual technology stocks frequently experienced severe drawdowns, equal-weighted baskets consistently reduced portfolio risk relative to holding individual stocks alone. Nevertheless, superior returns were accompanied by **higher volatility**. Every technology basket experienced a larger maximum drawdown than the S&P 500 over the corresponding investment period, illustrating that higher long-term returns required accepting substantially larger interim losses. Several companies—including **Microsoft, NVIDIA, Apple, Micron Technology, and Palo Alto Networks**—appeared repeatedly across multiple recommendation periods, suggesting persistent analyst conviction across changing market environments. However, the study also highlights that consensus recommendations are not infallible, with companies such as **PayPal, Zoom, Block, Baidu, and Rivian** producing poor long-term outcomes. Overall, the findings suggest that a diversified basket of consensus technology recommendations has historically been a competitive long-term investment approach. However, investment outcomes remain highly dependent on the prevailing market regime: post-bubble corrections and rising interest rates can significantly impair performance, while innovation-driven bull markets can create exceptional opportunities for technology leaders.