Ethereum: Multiple Spikes Into the 0. 618 Fib Keep Bulls in Check for BINANCE:ETHUSDT by DukesMarketAnalysis
Second Ethereum Chart of the Day Our second Ethereum chart of the day takes a closer look at the shorter-term picture, where the 0. 618 Fibonacci level at $1,920. 43 continues to frustrate the bulls. Multiple spikes into this area have attracted sellers, making it the immediate hurdle to overcome. Repeated Rejections Around $1,920 The repeated failures around the 0. 618 Fib show sellers are continuing to defend this technical level. Bulls are making another attempt, however, with price once …
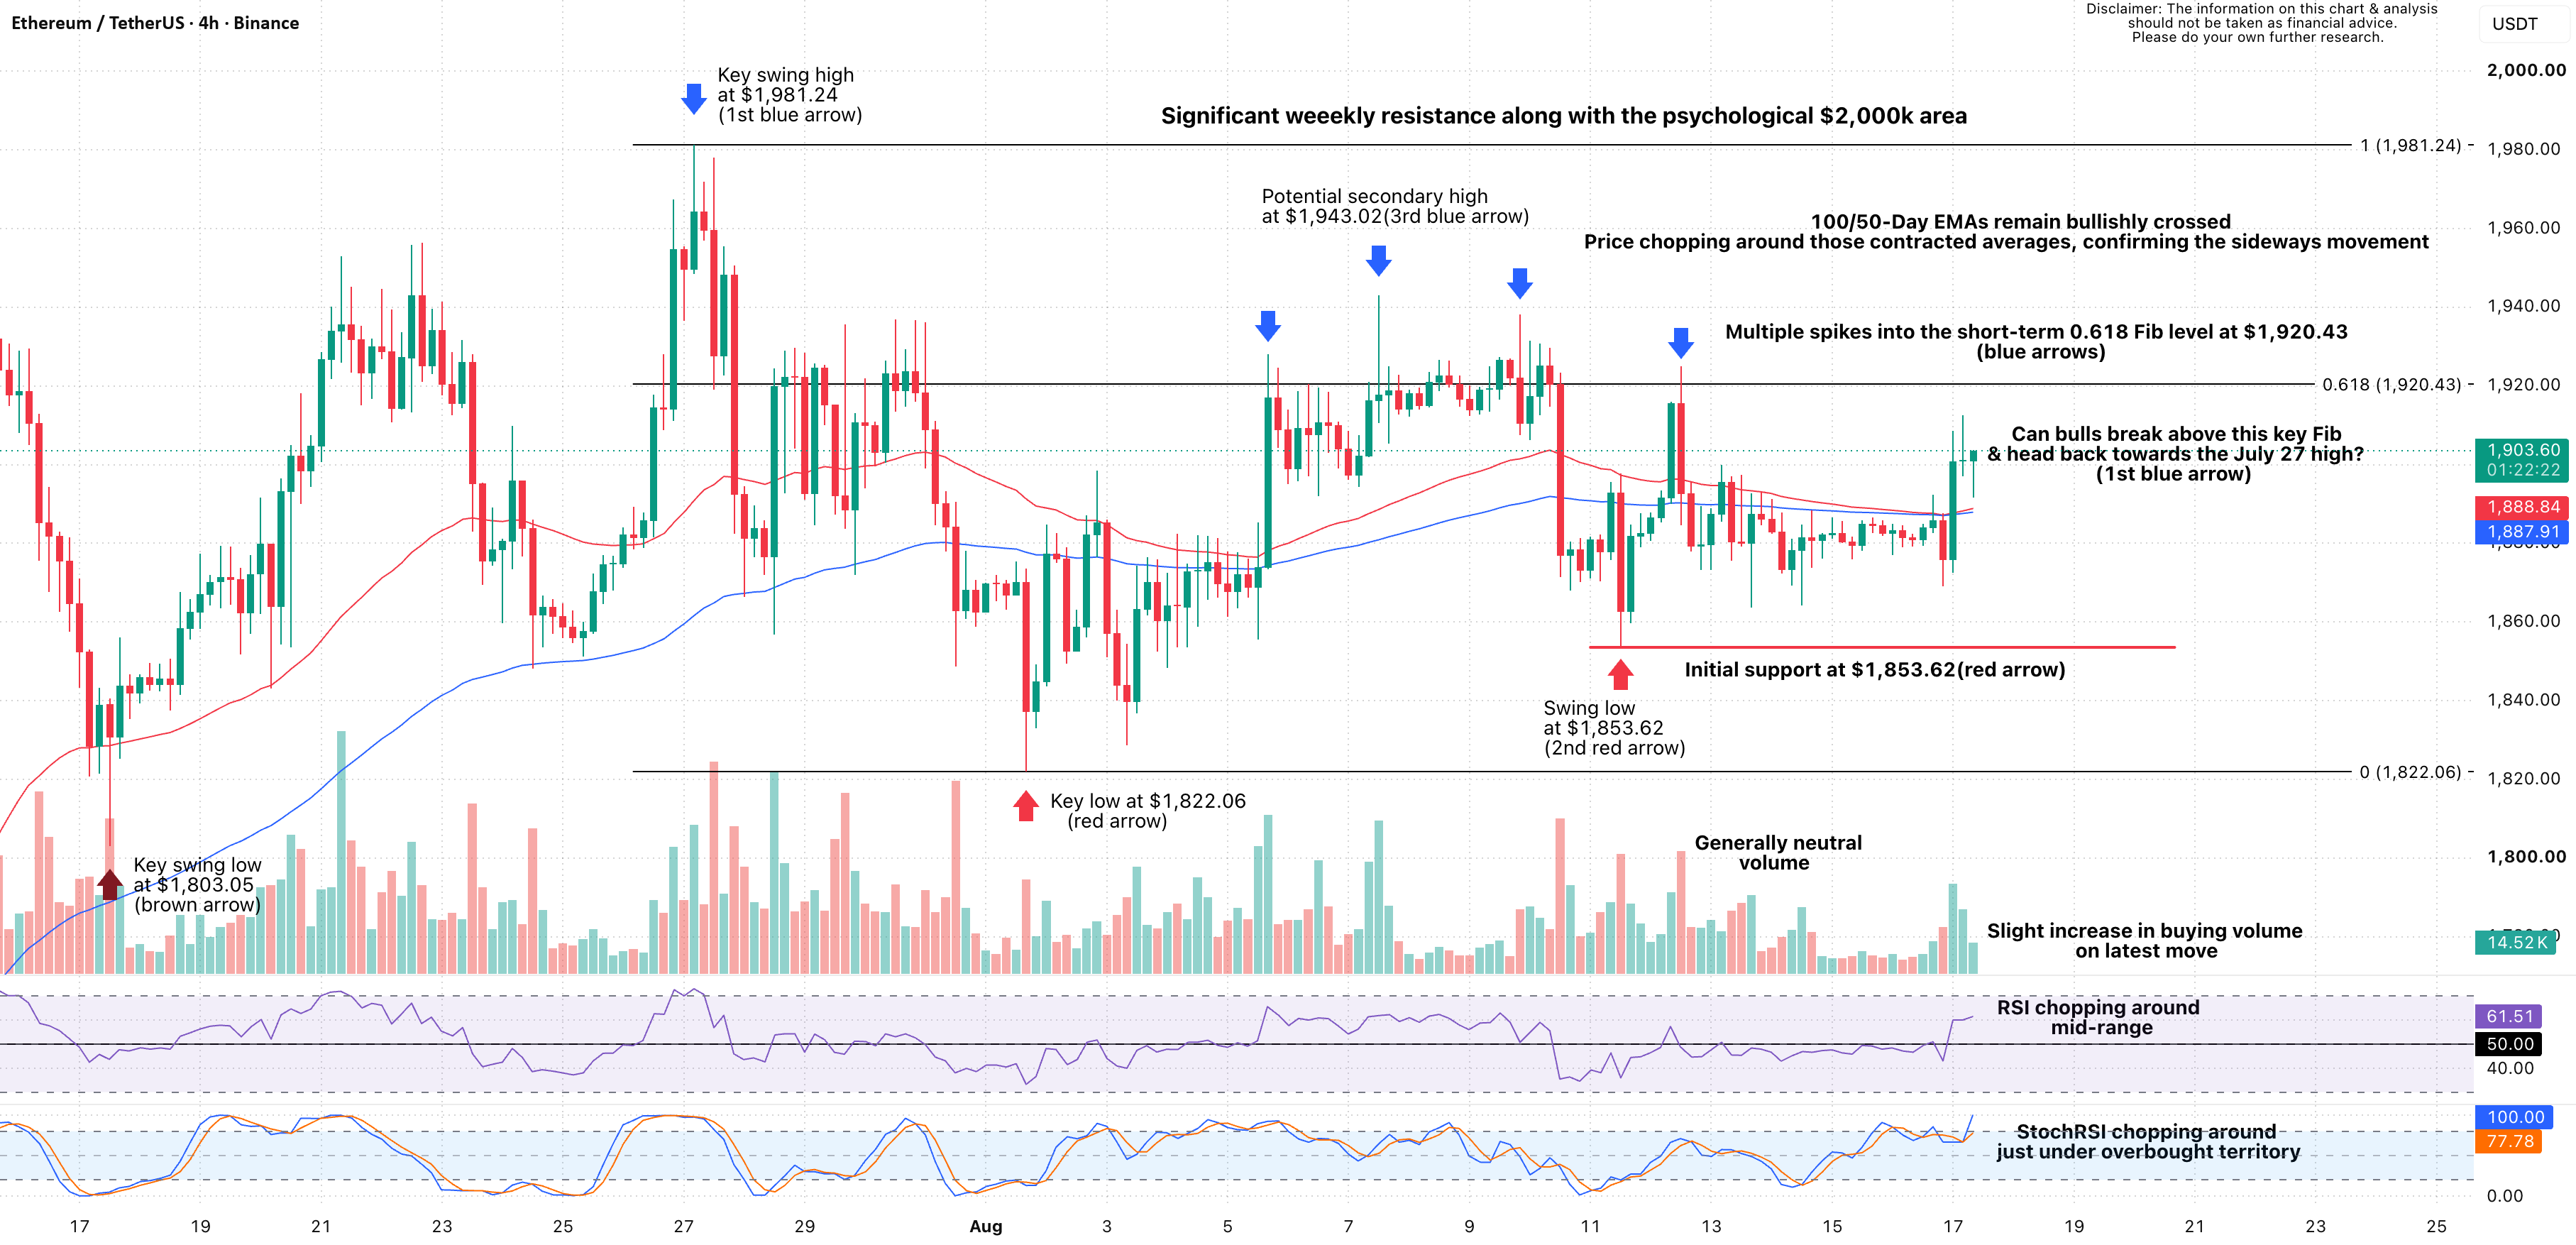
Second Ethereum Chart of the DayOur second Ethereum chart of the day takes a closer look at the shorter-term picture, where the 0. 618 Fibonacci level at $1,920. 43 continues to frustrate the bulls. Multiple spikes into this area have attracted sellers, making it the immediate hurdle to overcome. Repeated Rejections Around $1,920The repeated failures around the 0. 618 Fib show sellers are continuing to defend this technical level. Bulls are making another attempt, however, with price once again pushing back towards resistance. Moving Averages Confirm the ConsolidationThe 100/50-Period EMAs remain bullishly crossed but have contracted considerably, reflecting the sideways price action. Price is currently trading marginally above both averages. A Break Could Open the Door to $2,000A convincing break above $1,920. 43 would shift attention towards the July 27 high at $1,981. 24. Beyond that sits the significant weekly resistance and psychological $2,000 area highlighted in our first Ethereum chart. In SummaryOur second Ethereum chart of the day shows sellers continuing to defend the $1,920. 43 Fib, with multiple attempts to break higher so far failing. Price remains above the bullishly crossed 100/50-Period EMAs, keeping the short-term picture constructive. A convincing break above $1,920 would put $1,981. 24 and the psychological $2,000 area back in focus, while losing $1,853. 62 would weaken the setup and bring $1,822. 06 back into play. I analyse markets by observing levels, patterns, and structure. I share my process and reasoning for educational purposes, helping readers understand market behaviour without giving advice or predictions. Chart PatternsTechnical IndicatorsTrend AnalysisDisclaimerThe information and publications are not meant to be, and do not constitute, financial, investment, trading, or other types of advice or recommendations supplied or endorsed by TradingView. Read more in theTerms of Use. Chart PatternsTechnical IndicatorsTrend AnalysisI analyse markets by observing levels, patterns, and structure. I share my process and reasoning for educational purposes, helping readers understand market behaviour without giving advice or predictions. DisclaimerThe information and publications are not meant to be, and do not constitute, financial, investment, trading, or other types of advice or recommendations supplied or endorsed by TradingView. Read more in theTerms of Use.