Crypto Price Prediction for Today, June 18: Ethereum (ETH), XRP, Dogecoin (DOGE) - CaptainAltcoin
Crypto prices have struggled to maintain the recovery that started earlier this week, and several major assets are now testing important support levels again. Ethereum, XRP, and Dogecoin have all given back part of their recent gains. The next few hours could determine whether buyers regain control or whether another round of selling pressure pushes […]
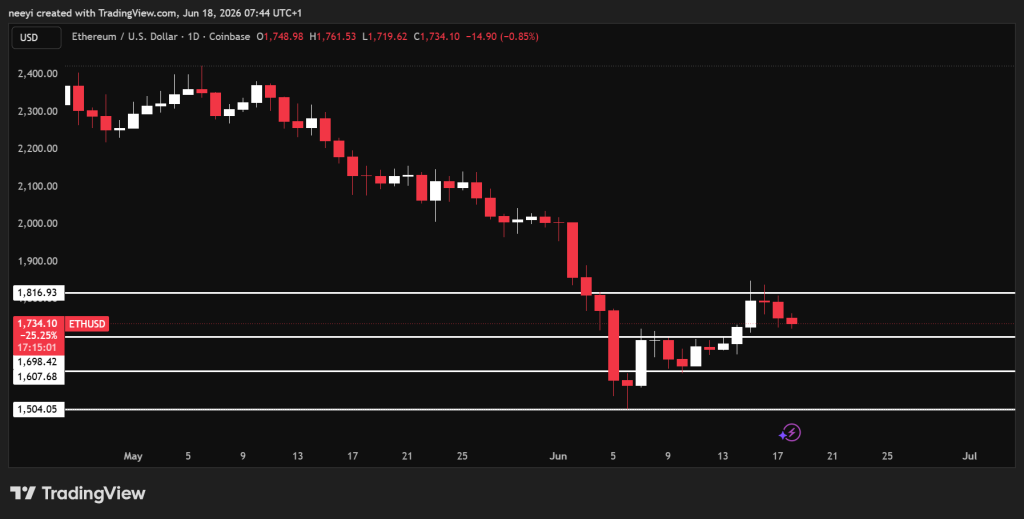
Home»Journal»Crypto Price Prediction for Today, June 18: Ethereum (ETH), XRP, Dogecoin (DOGE)Crypto prices have struggled to maintain the recovery that started earlier this week, and several major assets are now testing important support levels again. Ethereum, XRP, and Dogecoin have all given back part of their recent gains. The next few hours could determine whether buyers regain control or whether another round of selling pressure pushes prices lower. Ethereum remains above a major psychological level,XRPhas slipped deeper into a neutral zone after losing key support, and Dogecoin is fighting to avoid another bearish breakdown. A look at the latest technical indicators provides clues about what could happen next. What you'll learn 👉Ethereum Price Holds Above $1,700 but Selling Pressure Remains VisibleEthereum Price Prediction for TodayXRP Price Weakens After Losing Important Support LevelsXRP Price Prediction for TodayDogecoin Price Trades Between Bullish and Bearish TerritoryDogecoin Price Prediction for TodayFAQsEthereum Price Holds Above $1,700 but Selling Pressure Remains VisibleAfter a brief recovery attempt,Ethereum pricehas started to decline again. ETH price dropped from around $1,816 to close to $1,700 at the time of writing. A trade above the $1,700 level can still be viewed as bullish because it keeps the door open for buyers to regain control. Price action around this area remains extremely important. A break below $1,700 would weaken the bullish outlook. Such a move could leave Ethereum trading between $1,607 and $1,700 for the rest of today. A decline below $1,698 would strengthen the bearish case and could send ETH price toward $1,500 before the day ends. Ethereum Price Chart / TradingView. comThe Relative Strength Index currently reads 39. 9. This reading remains neutral but stays close to oversold territory. Buyers have not completely disappeared, though selling pressure remains visible. The Average Directional Index stands at 39. 6. This indicates a relatively strong trend exists, though it does not confirm the direction of that trend. Momentum reads 38. 2 and carries a sell signal. This shows recent price movement still favors sellers. MACD currently stands at negative 82. 0 and carries a buy signal. This often appears when downside pressure begins to weaken after an extended decline. The Ultimate Oscillator sits at 50. 2. That reading suggests balanced market conditions without a clear directional advantage. Name of IndicatorMetricInterpretation of ReadingsRelative Strength Index (14)39. 9Neutral with mild bearish pressureAverage Directional Index (14)39. 6Strong trend presentMomentum (10)38. 2Sell signal remains activeMACD Level (12, 26)-82. 0Buy signal after recent weaknessUltimate Oscillator (7, 14, 28)50. 2Neutral market conditionsEthereum Price Prediction for TodayThe bullish scenarioremains valid if Ethereum price stays above $1,700. Buyers could attempt another move toward the recent recovery zone and challenge resistance levels again. The neutral scenariokeepsETH pricebetween $1,607 and $1,700 as buyers and sellers battle for control. The bearish scenariobecomes stronger below $1,698. That breakdown could push Ethereum toward the $1,500 region before fresh demand appears. XRP Price Weakens After Losing Important Support LevelsXRP price has already entered a neutral zone after falling from around $1. 24 a few days ago. The bullish outlook weakened after Ripple price broke below $1. 21. Conditions became weaker onceXRP price movedbelow the $1. 169 support level. This development increases the possibility of additional downside pressure during today’s session. Current price action could keep XRP trading between $1. 169 and $1. 13 for most of the day. A break below $1. 13 would create a stronger bearish signal and could send Ripple price toward the $1 level. The Relative Strength Index reads 42. 39. This remains neutral and shows neither buyers nor sellers have complete control. The Average Directional Index stands at 28. 43. Trend strength remains moderate. Momentum currently reads negative 0. 00229 and carries a sell signal. Recent price movement still favors the downside. MACD stands at negative 0. 03643 and continues to show a buy signal. This could indicate bearish pressure is starting to slow. The Ultimate Oscillator reads 48. 08. Market conditions remain balanced. Name of IndicatorMetricInterpretation of ReadingsRelative Strength Index (14)42. 39Neutral market strengthAverage Directional Index (14)28. 43Moderate trend strengthMomentum (10)-0. 00229Sell signal remains activeMACD Level (12, 26)-0. 03643Buy signal emergingUltimate Oscillator (7, 14, 28)48. 08Neutral conditionsXRP Price Prediction for TodayThe bullish scenarioreturns ifXRP price climbsback above $1. 169 and establishes support above that level. Such a move could revive the case for another attempt toward $1. 21. The neutral scenariokeeps Ripple price trading between $1. 169 and $1. 13 through most of today’s session. The bearish scenarioactivates below $1. 13. A breakdown there could open the door for a decline toward the $1 area. Dogecoin Price Trades Between Bullish and Bearish TerritoryDogecoin price faces a situation similar to XRP. DOGE price haslost its earlier bullish structure and now trades in a zone that separates bullish and bearish outcomes. Current trading activity places Dogecoin between $0. 086 and $0. 082. Price may remain inside this range if neither buyers nor sellers gain control. DOGE Price Chart / TradingView. comA move above $0. 086 would restore a bullish outlook and could push DOGE price toward $0. 088. A break below $0. 082 would strengthen the bearish case and could send Dogecoin toward $0. 078. The Relative Strength Index reads 34. 81. This remains neutral but sits close to oversold territory. The Average Directional Indexstands at 31. 63. Trend strength remains noticeable. Momentum reads negative 0. 00193 and carries a sell signal. MACD currently sits at negative 0. 00374 and continues to flash a buy signal. The Ultimate Oscillator reads 40. 03. Market conditions remain neutral despite recent weakness. Name of IndicatorMetricInterpretation of ReadingsRelative Strength Index (14)34. 81Neutral near oversold territoryAverage Directional Index (14)31. 63Trend remains activeMomentum (10)-0. 00193Sell signal remains activeMACD Level (12, 26)-0. 00374Buy signal emergingUltimate Oscillator (7, 14, 28)40. 03Neutral market conditionsDogecoin Price Prediction for TodayThe bullish scenariobecomes active if Dogecoin price breaks above $0. 086. Such a move could send DOGE price toward $0. 088 and possibly higher if buying pressure increases. The neutral scenariokeeps Dogecoin moving between $0. 086 and $0. 082 as market participants wait for a clear direction. The bearish scenariodevelops below $0. 082. That breakdown could push DOGE price toward $0. 078 before support appears. FAQsHow much will $1 in Bitcoin be worth in 2030?If you invest $1 in Bitcoin today, it is projected to be worth between $5. 75 and $11. 50 by 2030, assuming its price reaches the widely predicted range of $500,000 to $1,000,000Can Dogecoin reach $3?Dogecoin reaching $3 is theoretically possible, but highly unlikely in the near term. It would require an unprecedented market-wide bull runCan Dogecoin hit $1 in 2026?Therefore,I don’t expect Dogecoin to post any gains during 2026, and I’m not surprised it has ticked lower to $0. 10. Subscribe toour YouTube channelfor daily crypto updates, market insights, and expert analysis.