Bitcoin Price Forecast Rejection Resistance Eyes Lower Support for BITSTAMP:BTCUSD by EA_BOT_Trader_00
Key Levels Resistance 4077–4083 (green zone) Price is currently testing this supply area. Sellers may defend this level initially. Support 4020–4025 (green zone) Previous resistance has become support. This is the strongest buy zone if price retraces. Major Demand 3960–3972 Strong institutional support. Bullish structure remains valid while this zone holds. Current Price Action Price has rallied aggressively without a meaningful pullback. That usually means one of two things: Small rejection …
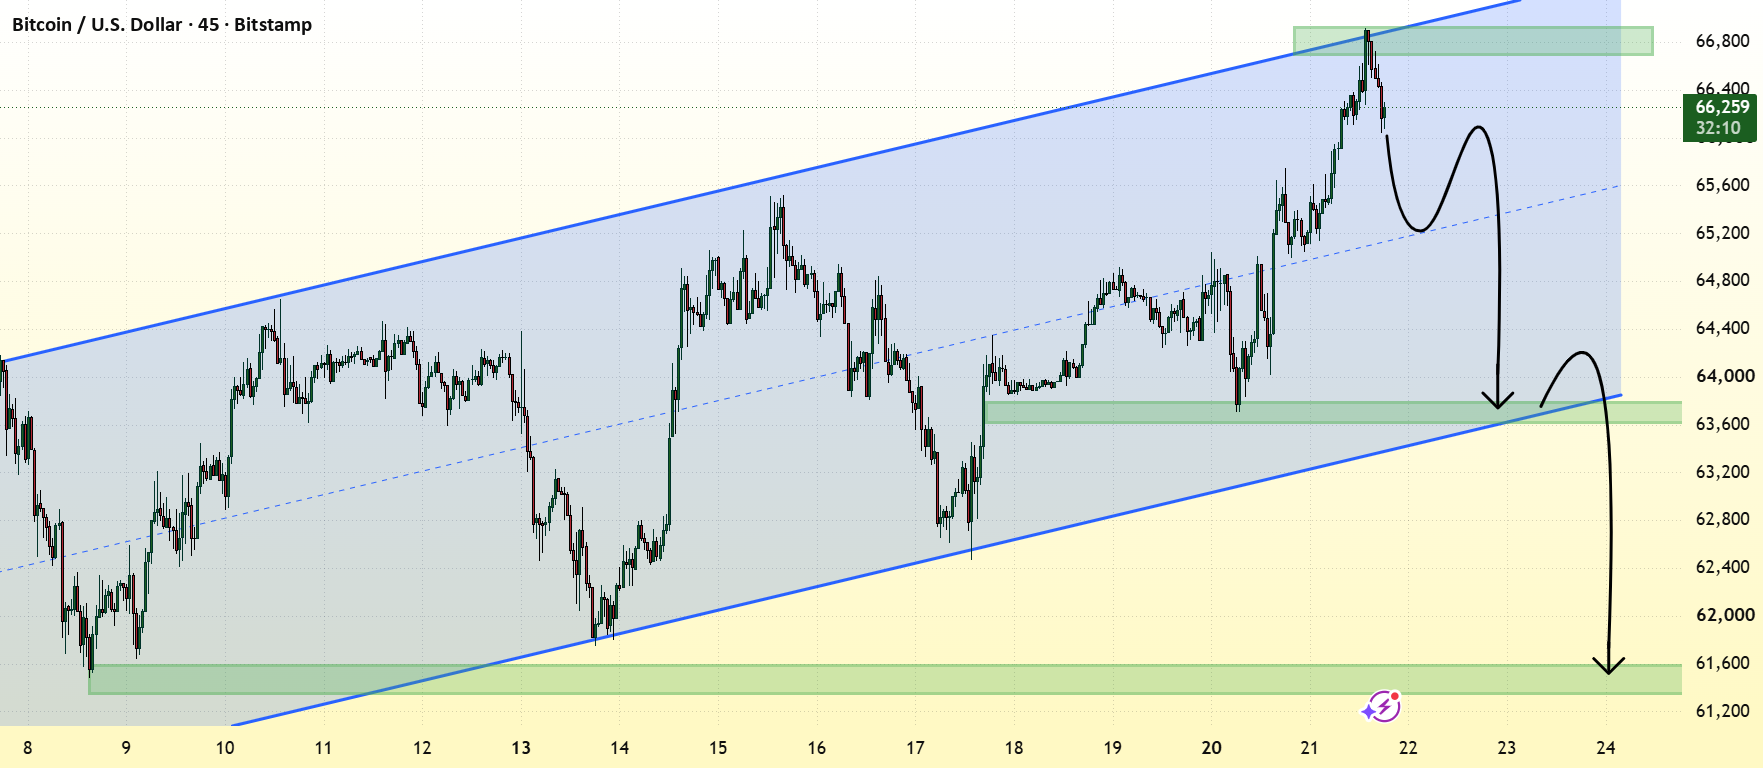
Key LevelsResistance4077–4083 (green zone)Price is currently testing this supply area. Sellers may defend this level initially. Support4020–4025 (green zone)Previous resistance has become support. This is the strongest buy zone if price retraces. Major Demand3960–3972Strong institutional support. Bullish structure remains valid while this zone holds. Current Price ActionPrice has rallied aggressively without a meaningful pullback. That usually means one of two things:Small rejection from resistanceRetracement into support before continuationThe blue path you drew is technically reasonable:rejection from 4078pullback toward 4022buyers defend supportcontinuation higherThis is actually the higher-probability scenario than chasing the breakout. Trade Idea 1 (Preferred)Buy the retracementEntry:4022–4026Stop Loss:Below 4012Conservative: below 4005Targets:TP1: 4078TP2: 4100TP3: 4120Risk-to-reward is attractive because you're buying after the pullback instead of buying into resistance. Trade Idea 2If price closes strongly above 4083 with high momentum:Entry:Breakout above 4085Stop:Around 4072Targets:410041154120Avoid entering if the breakout candle is already extended, as breakouts often retest before continuing. Bearish ScenarioThe bullish setup weakens if:4020 fails decisively. Price closes below 4015. Selling volume increases. If that occurs, the next downside levels are:400039803965 demandOverall BiasShort-term: BullishIntraday: Bullish while above 4020Swing target: 4100–4120Best entry: Wait for a pullback into 4020–4025, rather than buying at current resistance. Estimated probabilities (based on chart structure alone):Bullish continuation after a pullback: 70–75%Immediate breakout above 4083 without retracement: 25–30%Your projected path (rejection → retracement to the 4020 support → rally toward 4120) aligns well with the current market structure and is a technically sound scenario to monitor. You said:tittleChatGPT said:Here are some professional title options for your analysis:XAU/USD Technical Analysis: Bullish Trend Reversal Targets 4120Gold Price Forecast: Buy the Pullback Toward 4020XAU/USD Outlook: Bullish Breakout with Retracement OpportunityGold Technical Analysis: Higher Highs Signal Further UpsideXAU/USD: Bullish Structure Points to 4100–4120Gold Market Analysis: Trendline Break Signals Continued RallyXAU/USD 30M Analysis: Key Support at 4020, Target 4120Gold Price Prediction: Buyers Remain in Control Above 4020XAU/USD Trading Setup: Retracement Before the Next Bullish LegGold Analysis Today: Bullish Continuation Expected After PullbackRecommended title:XAU/USD Technical Analysis: Bullish Trend Reversal with Pullback Buy Opportunity Toward 4120You said:BTCUSD_2026-07-21_11-07-59. pngmake analysisChatGPT said:BTC/USD Technical Analysis: Rising Channel Breakdown Could Trigger a Deeper CorrectionBased on the 45-minute chart, Bitcoin is approaching a critical point after reaching the upper boundary of a rising channel. While the broader trend remains bullish, the recent rejection near resistance increases the likelihood of a short-term pullback. Market StructurePrice continues to trade inside a well-defined ascending channel. Bitcoin recently tested the upper channel resistance around 66,800–66,900 and faced strong selling pressure. The rejection suggests buyers are taking profits after the recent rally. Key LevelsResistance66,700–66,900 (green supply zone)This area remains the primary obstacle for further upside. First Support63,600–63,700Previous breakout zone and lower channel support. Buyers may attempt to defend this level. Major Support61,300–61,600Strong historical demand zone. A break below 63,600 could accelerate selling toward this area. Price OutlookThe chart suggests a higher probability of a corrective move before any continuation higher. Primary ScenarioRejection from the upper resistance. Pullback toward 63,600. If support fails, the decline may extend toward 61,500. This aligns with the bearish projection illustrated on the chart. Bullish AlternativeThe bearish outlook becomes invalid if Bitcoin:Reclaims 66,900 with a strong candle close. Breaks above the channel resistance. Holds above the breakout level. In that case, new highs would become the next likely objective. Trading PlanBearish SetupWatch for confirmation below recent swing lows. Initial target: 63,600Extended target: 61,500Bullish SetupWait for a confirmed breakout above 66,900 before considering long positions. Avoid buying directly into resistance without confirmation. Overall BiasShort-term: Bearish (corrective)Medium-term: Bullish while above 61,300Key level to watch: 63,600—its reaction will likely determine whether Bitcoin resumes its uptrend or extends the correction toward 61,500. DisclaimerThe information and publications are not meant to be, and do not constitute, financial, investment, trading, or other types of advice or recommendations supplied or endorsed by TradingView. Read more in theTerms of Use.